

By Morgan Allison
Not long ago, a customer was developing digitally modulated radios for deployment in airfields. The final step of his company’s testing policy required that his signal’s error vector magnitude (EVM) must be under a certain threshold. As any designer with highly-developed problem-solving abilities would do, he grabbed a vector signal analyzer that could do this kind of measurement, pulled up a constellation diagram, measured his EVM, and found it to meet and exceed the company’s standards. Having confirmed the radios’ performance with his own eyes, he deployed them, trusting their operation to be consistent with the test results. Soon after, his department received complaints that the radios were failing during most transmissions. After acquiring one of the offending radios, he ran it through the barrage of test procedures again, consulted coworkers, and had some uncomfortable conversations with his customers and superiors. No coworkers could provide any insight and things were looking grim for his project. The radios passed all the available tests and he could find no evidence of transmission or data failures.
Issues like this are more common than most designers care to think about. Fortunately, real-time spectrum analyzers (RSAs) can help with challenges like this. For example, the Tektronix RSA is a full-featured vector signal analyzer at its core, with a powerful IQ analysis engine, it also boasts real-time signal detection, triggering, and analysis capabilities.
Beyond the addition and integration of real-time spectrum analysis, the RSAs give designers an edge over other VSAs. Most vector signal analyzers on the market today were originally built as swept spectrum analyzers, and VSA capabilities were bolted on later as market forces drove the need for more complex measurements. This means they weren’t built as vector signal analyzers from the ground up and have some awkward limitations. Don’t get me wrong, they are capable of valuable measurements such as amplitude, frequency, and phase vs. time and any other derivative analysis like constellation diagrams and pulse analysis. In many cases, each analysis type has its own separate acquisition path, preventing multiple simultaneous measurements. For example, a VSA can look at amplitude, frequency, and/or phase vs time, but it can’t show the constellation diagram simultaneously and it can’t use the same trigger for both analyses. Because the RSA was built as a real-time spectrum analyzer from the ground up, it does not have this limitation, and it can analyze all of these things simultaneously using a single common trigger to ensure that each display is analyzing the same data.
Back to the story.
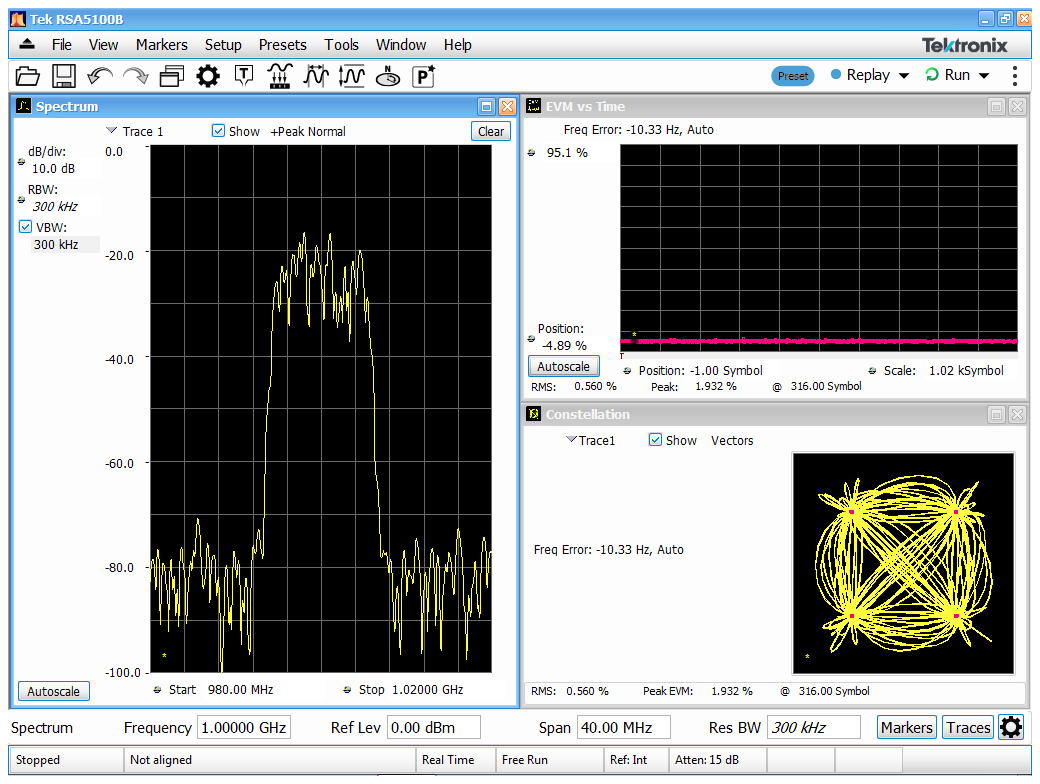
The customer called us in to see if we could help him. We agreed to assist and brought in the RSA5126B to test the radio. As a sanity check, we used the RSA to do the same tests he had done previously with his own instrumentation. We placed the instrument in free-run, where it grabs and processes chunks of data as fast as it can. This gives us between 20 and 50 acquisitions per second, as is typical of any instrument operating as a VSA. Then, we set up a general-purpose demodulation measurement and confirmed that the signal appeared to have very low EVM over a hundred or so acquisitions as shown below.

Next, we fired up our real-time DPX display to see a more complete view of the signal environment. Instead of 20-50 spectrums per second, we were now seeing over 3 million. Within seconds of turning on DPX, we discovered the culprit. We picked up significant spectral spreading that occurred about once per second. The VSAs never even hinted that this problem was present, but the RSA caught and displayed the signal every time it occurred using DPX as in the screen capture below.

The ability to see this problematic signal is valuable all by itself, but the RSA goes several steps further and provides tools to analyze the signal in detail. We wanted to determine the root cause of the intermittent radio failures, and analyzing the signal that causes this spectral spreading would help us do this. Remember, plenty of spectrum analyzers can show a constellation diagram and demodulate a signal, and some can show a real-time display, but the RSA is the only one that can show both at the same time and use data from the real-time display to trigger the vector signal analysis measurements.
Note: Stay tuned for the rest of our story in Part II of our “Real-World, Real-Time” blog post about how we solved our customer’s challenges with their airfield radios.